

From Easy to Automated: Introducing prognotix AutoPilot

Most forecasting projects don’t stall on the modelling. They stall somewhere between the export and the first training run.

Someone pulls a sales file out of the ERP. Then the questions start.

  • Is this monthly or business-daily?
  • Which columns define a series: Country, product, both, plus subcategory?
  • Is Sales the target, or is it a derived field that will quietly poison the model? Are there enough data points per series to learn from, or are we about to forecast eight series with forty observations each and call the result a plan?
  • Should we add external signals, and if so, which ones actually relate to this business?

None of these are exotic questions. They’re the questions our data scientists work through in the first workshop of every engagement. But they take time, they require experience, and until they’re answered, nothing runs.

AutoPilot closes that gap and takes you from easy to automated.

Photo by Erik Mclean @ Pexels.com
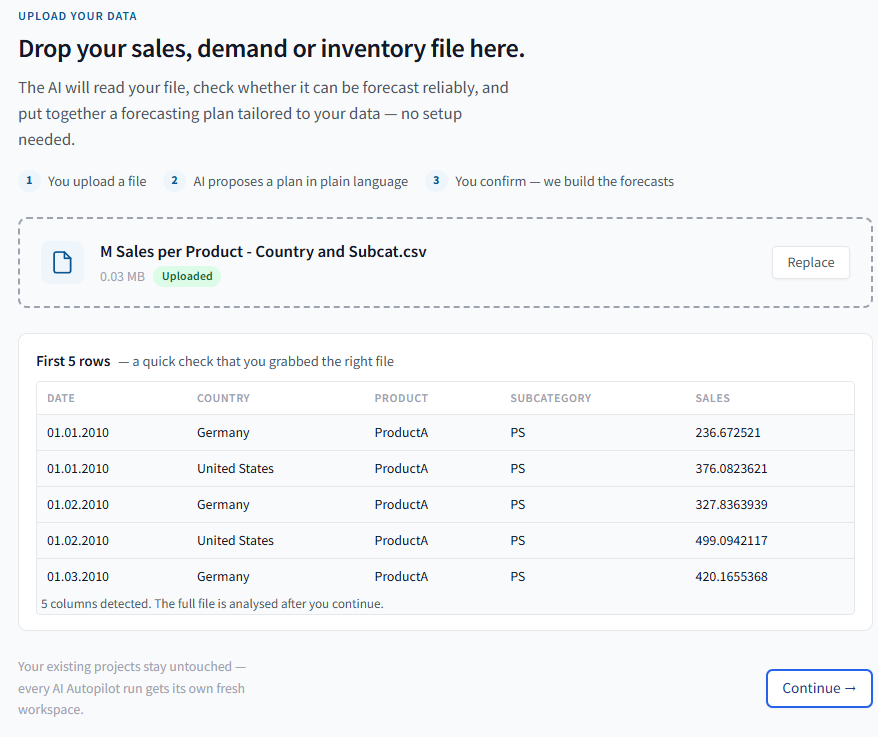
Upload your data set

What AutoPilot does

You import a dataset and describe your goal in plain language, what you want to forecast, and how far ahead. AutoPilot then does what an experienced forecasting practitioner would do on day one:

  • reads the file structure and checks whether it holds together
  • assesses whether the data is forecastable at all, before you invest time in training
  • proposes a role for every column, with a stated reason
  • suggests a training setup, including horizon, validation strategy and error metric
  • identifies external data that plausibly relates to your business and matches it to your markets
  • sets up a control run so you can tell whether the extra complexity actually helped

Then it stops and shows you the plan.

That last part matters more than anything else on the list. AutoPilot doesn’t run a black box and hand you a number. It hands you a proposal you can read, question, and change, one screen, in the language of your business rather than the language of a model.

A worked example

Here is what that looks like on a real file: a monthly sales export with 828 rows and five columns, covering three countries, two products and two subcategories from January 2010 to March 2021.

The verdict first. AutoPilot opens with a plain judgement: the file is forecastable. The date column runs monthly for more than eleven years, and the target has enough movement to learn from. That single line saves a surprising amount of wasted effort, anyone who has spent two days preparing a dataset only to discover it was never going to support a twelve-month forecast knows the value of hearing “no” early.

The structure. AutoPilot identifies eight active series from the country × product × subcategory combinations, with an average of 103 observations each and a range from 87 to 135. It confirms the file is already at the forecast level, no row aggregation needed. It parses the dates as day-first from the sample values, notes a median gap of 31 days consistent with monthly frequency, and observes that weekdays are spread across all seven days, so this is not a business-day-only extract. Zero date gaps. Zero outliers. Growing trend, monthly seasonality.

Review AutoPilot's analysis

Trabs

The honest caveats. The target shows 2.9% zeros and a max-to-median ratio of 3.49, which AutoPilot explicitly flags as not a unit-mix signal, meaning it doesn’t suspect mixed measurement units hiding in the column. Small point. Exactly the kind of small point that costs a week when nobody catches it.

The column roles. Each assignment comes with its justification. Sales becomes the value to predict because it’s the varying business measure with 777 distinct values and a real range. Country becomes a grouping field, three values, a natural way to split by market. Same logic for Product and Subcategory. You can override any of them, but you’re overriding a stated argument, not a silent default.

The experiment design. AutoPilot proposes two trainings, not one. The first uses the full market and product split with external signals. The second is deliberately stripped back to core columns only. The stated purpose: to show whether the added split information actually improves the twelve-month forecast. This is how our data scientists work, you don’t just build a model, you build something to compare it against.

The external data. Four Eurostat series are suggested, each with a confidence score and a business rationale. Trade Sales Volume Index at 88% confidence, because it tracks wholesale and retail demand in the same broad market. Consumer Confidence at 81%, because household sentiment tends to move sales in the same month or shortly after. Inflation at 79%. Industrial Production at 76%. Each is matched to the right country code, and AutoPilot lists further data sources worth considering that aren’t yet available in the platform.

Total elapsed effort from the user: import a file, state a goal.

Getting started

We published an honest account of our forecasting pilot with TGW Logistics recently, and the line that stuck with us came from their Head of Supply Chain Management: there’s no magic button. Bad inputs produce bad outputs, no matter how capable the platform.

AutoPilot doesn’t repeal that. What it does is make the input question visible and answerable in minutes rather than weeks. When a dataset isn’t fit to forecast, you hear it immediately and with a reason attached. When it is, you start from a setup that reflects how experienced practitioners would have configured it.

The forecast still has to be defensible to a controller. AutoPilot is built so that it can be: every choice it makes is written down, in plain language, before a single model runs.

AutoPilot is available now to all prognotix customers. If you have a dataset and a question you’d like answered, even one you’re not sure the data can support, that’s a good place to start. Finding out quickly is the point.